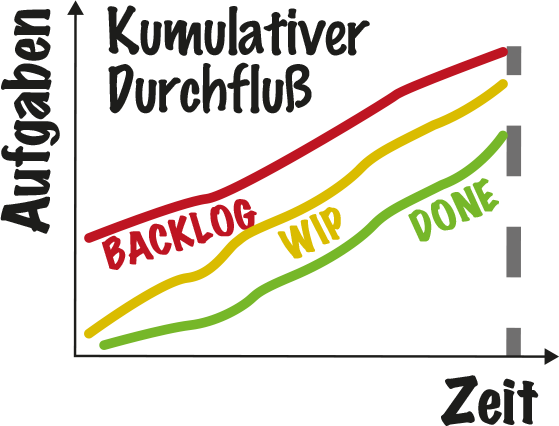
Finally data: give support to your gut feeling.

,,Which process optimization has the greatest impact? Where should we “tackle” our work process without going through too many trial-and-error loops?”
Data that is very easy to collect helps answer this question: a cumulative flow diagram records and visualizes which cards are currently where on a daily basis. This provides the KANBAN team with important information:
The “Cumulative Flow Diagram” holds all of this data in an easy-to-understand visualization so that every team member is well informed about the current status of the team. The knowledge of being well informed calms you down and helps you to feel a strong basic RELAXATION. You can be happy with yourself and the team and be in FLOW. Provided they are used responsibly, “data and facts are always friendly!” 🙂

Surprise: accurate delivery forecasts.

Being able to accurately predict to the customer when delivery will take place and stick to this forecast creates trust. By recording processing times over a period of several weeks, the KANBAN team can make better forecasts.
This in turn helps customer project managers, for example, with their planning – premature escalations and unnecessary pressure are avoided because buffer times can be reduced.